Functions
Introduction
Functions in GraphExpert Professional are handled as an “evaluator object” that can generate a single dependent variable, on-demand, from a given independent variable or variables. A function can optionally have parameters that are adjustable either by the user, or by an algorithm such as a regression.
There are two types of functions in GraphExpert Professional: Simple functions, and see Programmed functions. Simple functions are just a single expression (y = f(x)), and are sufficient for most purposes. However, if your needs are more demanding, a programmed function allows you to write a Python code that can be as complex as required to evaluate a function.
Simple functions
New functions in GraphExpert Professional can be created via several means, which are listed below.
From scratch
A new function can be created directly via the Create->Function main menu choice (or the corresponding toolbar button). The following dialog will then appear:
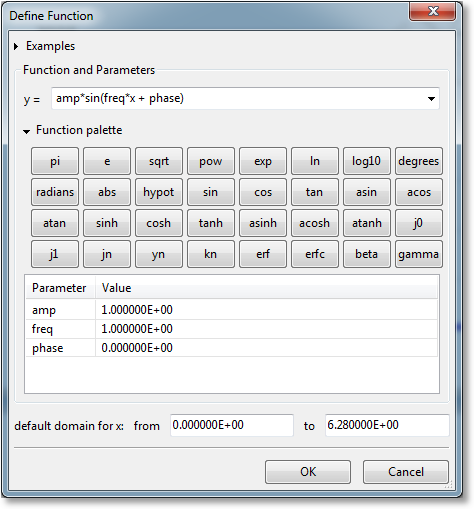
A new expression can be typed directly into the y = field. Here, the full complement of functions as documented in Appendix A: Math Functions can be utilized. For convenience, however, a function palette can be expanded, which appears as a set of calculator-like buttons. Pressing any of these palette buttons will insert the corresponding text into the y = field, or you are free to simple type the expression out yourself. Remember that the function palette only has a subset of the available functions in GraphExpert Professional.
In the expression, “x” is always interpreted to mean the independent variable. Likewise, if you are forming a 3D function, “x1” and “x2” are interpreted to mean the first and second independent variables, respectively.
Any other variables introduced in the expression are taken to be parameters. This allows the creation of a function with adjustable parameters. For example, if your expression is “cos(freq*x)”, then “freq” is taken to be an adjustable parameter, which you can then set in the Parameter/Value table. Parameters are automatically detected as you type.
The default domain for your function affects how it is autoscaled on any graph that it is placed on. The autoscaling mechanism will look at the default domain range and take this as a bound for the x-autoscaling, and do a quick evaluation of the function over the default domain to determine the y-autoscaling. The default domain mechanism works analagously for a 3D function; the default domain is set for the x1 and x2 axes and the same procedure applies.
Also, previous functions that have been defined by the user can be accessed via the small down-arrow pulldown at the right end of the y = field.
Note
The OK button will not enable until the expression given is valid.
Mathematical Operations
Obviously, the standard arithmetic operations are supported. Multiplication is performed with a *, division with /, addition with +, and subtraction with -. Raising a quantity to a power is performed with either ^ or **, with the ** notation being preferred. Grouping is performed with parentheses ().
Reserved Words
In any model, the independent variable is always denoted by x. If you are writing a function that is a function of multiple independent variables, these are denoted as x1, x2, x3, and so on. Each of these special variables are reserved words and cannot not be used as a parameter name in your function.
All mathematical functions supported by GraphExpert Professional, such as sin, cos, tan, exp, etc., are also reserved words. See Appendix A: Math Functions for a complete list of the mathematical functions supported.
Any other name that GraphExpert Professional sees in your model is treated as a parameter. This powerful feature lets you name your parameters any name that you find appropriate, such that the function’s syntax carries meaning. Thus, names such as beta, my_long_parameter_name, and b are all legal parameter names. Note also that names are case sensitive; the parameter a is distinct from the parameter A, for example.
As a child of a dataset
GraphExpert Professional supports various operations on datasets that result in a function. Two examples are linear regression and cubic splines. Creating a function in this manner is documented in Operations on Datasets.
Via drag and drop from CurveExpert Professional
Any result computed from CurveExpert Professional can be dragged into the Components pane to add it to GraphExpert Professional. If the result is dragged onto the graph itself, it is both added as a component, and added to that graph in one step.
Programmed functions
To create a new programmed function, choose Create->Programmed Function from the main menu. The following dialog will then appear:
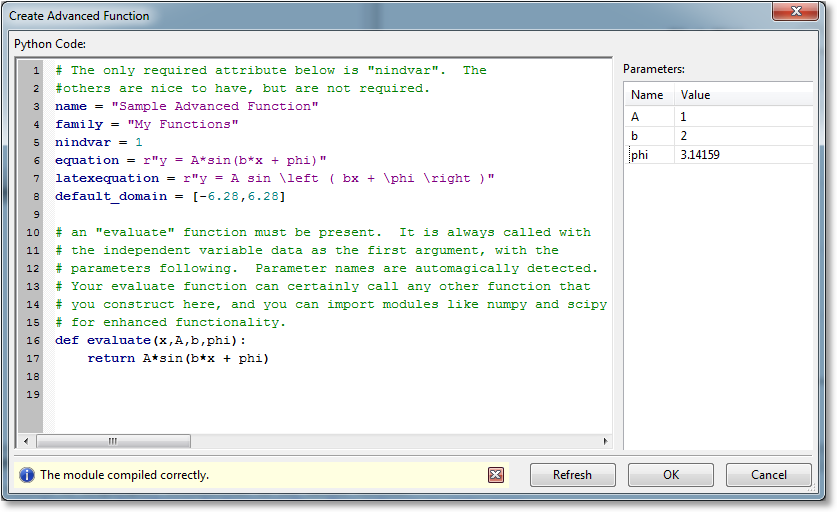
To make sure that your function is valid code, press the Refresh button. If the code compiles correctly (this does not imply correctness of the code itself), an information bar will appear at the bottom to indicate this. If the code does not compile correctly, a stack trace will appear in the information bar to help you track down the problem.
The second purpose of the Refresh button is to allow a rescan of the code to determine the number of parameters that are passed to the “evaluate” functions. These parameters appear in the Parameters list, and you can set their numerical values there as well.
Writing the code
Every programmed function must have one evaluate function, and the nindvar attribute must be set. The evaluate function is what will be called whenever a result is required of your programmed function. nindvar informs the application how many independent variables are involved when the function is evaluated.
Rather than trying to reinvent another language for the user to express a model in, GraphExpert Professional uses Python as its base scripting language. Thus, anything that can be done in Python can be done in your programmed functions. This gives the user extreme flexibility, even to do things like download data from a web server that influences how the function is evaluated. Here, your creativity is the only limit.
As you enter the Python code for your function, it is syntax highlighted, and syntax errors are detected dynamically. The standard cut/copy/paste operators are also available for use as you write your code.
Documenting the entire Python language and its capabilities are obviously outside the scope of this document; for this, refer to http://docs.python.org/release/2.6.6. You do not, however, need to be proficient in Python to be reasonably productive directly editing a programmed function. Just follow the examples given here and in the programmed function dialog itself.
Note
Python uses indentation to identify code blocks (for example, the code that should execute when an if statement is true). So, if you have an unexplainable syntax error in your model, make sure that your indentation is correct.
As in regular Python, any characters following a # sign are a comment, and are highlighted in green in the coding window.
Every programmed function must have an evaluate function defined, and a nindvar attribute set. Other items that specify metadata (name, equation, latexequation, default_domain), are optional.
nindvar
This is a variable to define the number of independent variables that this programmed function expects. Most of the time, this value will be 1, but can obviously be higher depending on how many independent variables that you want to be associated with your programmed function. If greater than one, the x variable passed to evaluate is a 2D dataset consisting of all of the independent variable columns.
name
This is an attribute to define the name of your programmed function, which is the name that is used for the component that is created for your programmed function, by default. The type of this attribute is a string, and should be enclosed in quotes.
family
The family attribute is not currently used but is reserved for future use.
equation
This is an attribute that is a text representation of the equation. It is for information only, and is displayed by GraphExpert Professional in different areas of the software.
latexequation
This is an attribute that is a mathtext representation of the equation (see Mathtext and Appendix B: Math Symbol Reference for how to write in mathtext). In short, this is a TeX-like version of your equation that will be used every time a graphical rendering of your equation is required in GraphExpert Professional. This attribute is optional, but if not given, renderings will show “no equation”.
default_domain
The default domain is used for autoscaling purposes, and should be given as a list with a min and max value that should be used as the limits for autoscaling. The default domain itself determines the limits in the x, and the limits of the function evaluated over the default domain determines the limits in the y. An example is:
default_domain = [0.1,1.1]
For a 3D function (nindvar = 2), the default domain should be given as a 2D list; for example:
default_domain = [[0.1,1.1],[-1.0,1.0]]
which gives a domain of 0.1 to 1.1 on the x1 axis, and -1.0 to 1.0 on the x2 axis.
Remember that the default domain only suggests a range to the autoscaling mechanism, and that is its only purpose. It is certainly possible to visualize more of your function as needed, in a different range.
evaluate(x,param1,param2,param3,...)
This is the most important part of your programmed function; evaluate() is a function that is called whenever your program is evaluated with the independent variables and a set of parameters. This obviously occurs when GraphExpert Professional needs to draw the function on a graph.
The evaluate function must take x as its first argument. This x is the vector of independent variables, and can be multiple columns if there is more than one independent variable. Following x is a comma separated list of parameters, which can have any name. The job of the evaluation function is to take these pieces of data and compute an output vector y, returning it as the result of the evaluation.
An example of an evaluate function is the following (with comments removed for brevity):
def evaluate(x,a,b,phi):
    return exp(a + b/x + phi*log(x))
Any other Python functions in your script (denoted by the def keyword) other than evaluate are ignored. This means that you can create your own Python functions and call them from your evaluate function as you wish.