User Interface
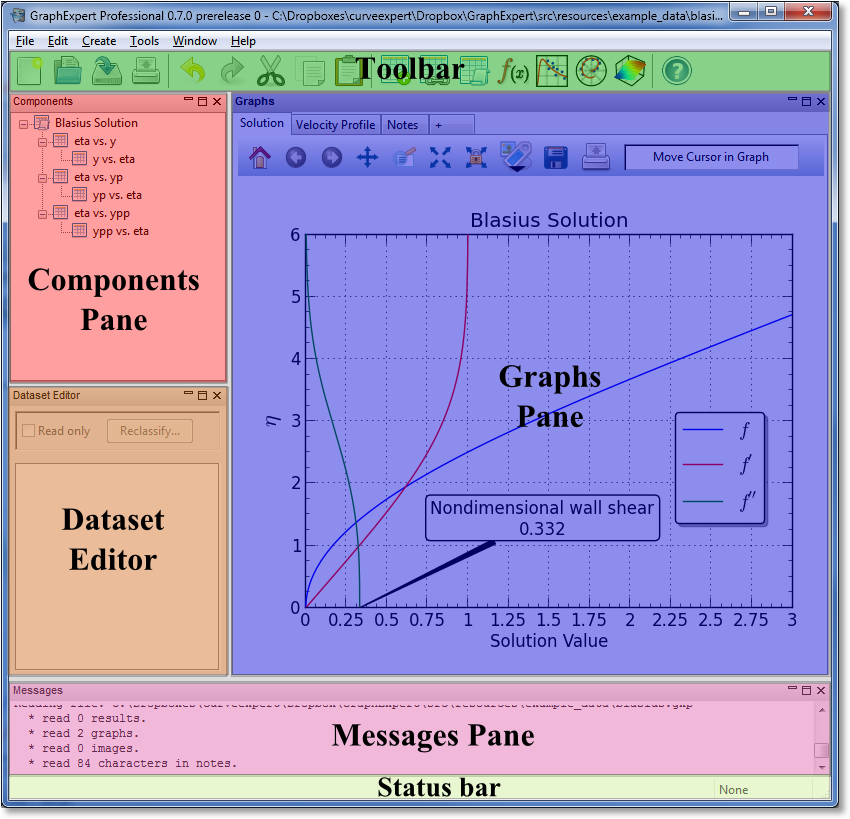
The GraphExpert Professional user interface is divided into four panes:
- Components
- Dataset Editor
- Graphs
- Messages
The panes, as well as the toolbar and status bar, are labeled clearly in the graphic below:
All of the panes can be shown or hidden via the Window menu in the menu bar. Further, panes (except for the Graphs pane) can be torn out from the main window; grab the pane by its title bar, and tear it out. The panes can be redocked in the main window by the reverse operation; drag the window to one of the docking indicators, and a transparent hint will appear to show where the window will be docked. Using this procedure, the panes can be rearranged inside the main window to taste.
Panes can be quickly maximized by clicking the small box at the top right of each pane; this allows the pane to fill the entire main window. Restoring the size of the pane can be performed by clicking the double-box at the top-right of the pane. This gives a quick means of viewing a particular pane (most commonly the Graphs pane) in full size.
All panes can be hidden by clicking the ‘X’ at the top right of the pane, or by deselecting the corresponding pane name in the Window menu. To show a pane after being hidden, select the corresponding pane name in the Window menu.
Toolbar
The toolbar can be shown or hidden via “Window->Toolbar”.

Each button on the toolbar has a one-to-one mapping to an item in the menus. The toolbar is divided up into the following sections:
- File
- Edit
- Create
- Help
The buttons are each documented below.
| Icon | Meaning |
|---|---|
 |
File->New. Reinitializes the application with no components and no graphs (completely empties the document). |
 |
File->Open. Open a GraphExpert Professional file. |
 |
File->Save. Save the current components, graphs, and notes into a GraphExpert Professional document. |
 |
File->Print. Prints all graphs. |
 |
Edit->Undo. Undo the last appropriate action |
 |
Edit->Redo. Redo the last appropriate undone action |
 |
Edit->Cut. Cut the selected items(s), placing them on the clipboard |
 |
Edit->Copy. Copy the selected item(s) to the clipboard |
 |
Edit->Paste. Paste the contents of the clipboard appropriately into the focused pane |
 |
Create->Dataset. Create a new dataset to work with, having the specified size and fill. See Creating new datasets. |
 |
Create->Hot link. Create a new link to a file that acts as a source for a dataset; dataset automatically updates when the file changes. See Hot linking to a text or Excel file. |
 |
Create->Miniprogram. Create a Python code that returns a dataset. See Miniprograms. |
 |
Create->Function. Create a continuous function that can be used directly for plotting or to derive other datasets. See Functions. |
 |
Create->XY Plot. Create a fresh XY plot in the Graphs pane. See XY Plots. |
 |
Create->Polar Plot. Create a fresh polar plot in the Graphs pane. See Polar Plots. |
 |
Tools->3D Plot. Create a fresh three dimensional plot (for plotting items with two independent variables) in the Graphs pane. See 3D Plots. |
 |
Help->Manual. Open the documentation. |
Components Pane
The Components pane is the heart of data management in GraphExpert Professional. Here, you will see all available datasets and functions that can be visualized, as well as the parent/child relationship between them. Right clicking in the empty area underneath any component items will display a context sensitive menu allowing you to create datasets (see Creating new datasets), create functions (see Simple functions), create hotlinks (see Hot linking to a text or Excel file), or import data from file (see Importing from file).
Components can be used to create another components; in essence allowing the user to derive datasets and functions from existing datasets and functions. See Managing Datasets and Functions for how to operate on your components that are displayed.
Hovering your mouse over any component will provide a tooltip that displays vital information concerning that component. For example, for a dataset that is a transformation of another (see Transform), the tooltip will display the number of rows and columns in the dataset, and the transformation expression. If there has been a problem in evaluating a derived dataset, the tooltip will also indicate the reason for the problem.
A component may be renamed by right clicking it and selecting Rename, or, one can click on an already selected component, and the name will become editable. Also, pressing the F2 key is a shortcut to be able to rename a component.
Components may be multiple-selected by holding the Shift or Ctrl key while selecting components. Once a group of components are selected, any action performed by a right click applies to all of the selected components.
Double clicking on a component invokes an appropriate action to view it. For a function, a popup window shows the equation for the function and the parameters of the function (if any). If the double-clicked component is a dataset, the Dataset Editor opens the dataset in a new tab (if necessary).
A component (or multiple components) can be removed by right clicking it and selecting Remove; or press the Del key.
Icons
The icons displayed in the Components pane convey information about the type and state of each component.
| Icon | Meaning |
|---|---|
 |
A dataset stored in memory. |
 |
A dataset stored in memory where the data may not be correct. Example: taking the integral of unsorted data. |
 |
The component is a dataset, but the updating has failed catastrophically. Example: complete failure in evaluating a transform. |
 |
An actively updating dataset hotlink. |
 |
A hotlink that is active and linked to a file, but the updating has been paused by the user. |
 |
A hotlinked dataset where the updating from file failed. Example: the file is unavailable or no permissions to read. |
 |
A dataset that is generated by the action of a miniprogram. |
 |
A miniprogram dataset that has failed due to an exception in the Python code, or does not return the correct information. |
 |
A simple expression function. |
 |
A function that has not updated properly, so the previous state was retained. |
 |
A function that has failed catastrophically. Example: divide by zero in the function. |
 |
A programmed function. |
 |
A programmed function that has not updated properly, so the previous state was retained. |
 |
A function that has failed catastrophically, due to an exception in the Python code, or does not return the correct information. |
Dataset Editor
The Dataset Editor pane is a notebook where datasets can be edited or viewed. A dataset can be edited/viewed by
- double clicking the dataset in the Components pane
- drag/drop of the dataset from the Components pane
- right click the dataset in the Components pane, and select View/Edit from the context menu.
Once your dataset is opened in the Dataset Editor, a new tab will be created for it. This tab will remain until either the dataset is destroyed (in the Components pane), or you close the tab by right clicking it and selecting Close.
A dataset can be made read only (protected from editing) by selecting the Read only checkbox near the top of the Dataset Editor pane.
Note
Only datasets that are are the top of the Component hierarchy can be edited; other datasets, by definition, derive their values from their parent dataset, and such their values are noneditable. These datasets can be viewed in the Dataset Editor, but the Read only checkbox will remain dimmed and selected to indicate the “always read-only” nature of child datasets.
A dataset can be reclassified (see Reclassifying columns) from the Dataset Editor by clicking the Reclassify button near the top of the editor pane. This is an equivalent operation to right clicking the dataset in the Component pane, and selecting Reclassify.
See The spreadsheet for documentation concerning how to operate and use the features of the data spreadsheet.
Graphs Pane
The Graphs pane is a notebook where all graphs reside (as well as any notes that you would like to save). Refer to Graphing for documentation concerning how to work with graphs.
To add another graph, press the “+” tab; this asks you what type of graph to add, and then adds that graph to the notebook for you to work with as you see fit. You may also rename any of your plots by right-clicking on the tab and selecting Rename; this assists in keeping track of multiple graphs. Also, you can delete a graph entirely by right-clicking the graph tab and selecting Delete. Finally, you can copy (clone) a graph by right-clicking the appropriate graph’s tab and selecting Clone.
Remember that, for a graph that you have created, you can drag and drop components from the Components pane to visualize anything of interest.
Messages Pane
The Messages Pane is an area where GraphExpert Professional sends all notifications for your perusal. For example, when a file is read, the a summary of the file contents appears in the Messages pane. Also, when any calculation is undertaken, a summary of the result appears in the Messages pane.
The content of the messages pane can be copied and pasted to another application by highlighting a portion, right-clicking, and selecting Copy, or by using Ctrl+C (on a Mac, Cmd+C).
Error messages appear in the Messages pane in red, and special messages appear in blue. All messages that appear in the Message pane are automatically logged, and be accessed after-the-fact via Tools->Log Viewer (see Log Viewer).
Status bar

The status bar is divided into sections, which show the following items:
| Section | Displays |
|---|---|
| 1 | help for menu items and toolbar buttons |
| 2 | current locale |
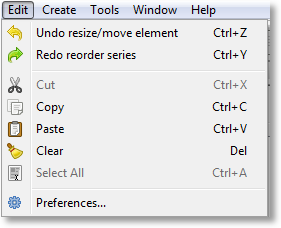
Undo and Redo
In the Edit Menu, the Undo and Redo items always indicate what will be undone or redone; this useful feature tells you as the user exactly what will happen upon selection of an Undo or Redo.
At the present time, each pane in GraphExpert Professional keeps track of its own undo states. Therefore, the proper pane must be “focused” to perform undo/redo actions on the context in that pane. The “focus” of a pane is shown by its title bar being colored and the pane name being bolded. Focus can be transferred from one pane to another by simply clicking the mouse in the desired pane.
Usually, this requirement is intuitive and transparent to the user. For example, if a user is working in the Component pane (creating datasets, say), the Component pane already has the focus, so undo/redo works naturally. However, if the user is working in the component pane, and decides that an edit in the Dataset Editor should be undone, the user must click in the Dataset Editor pane somewhere before issuing the undo; otherwise, it is the Components pane that services the undo request. Observing the text in the Undo and/or Redo entries in the Edit menu is an easy way of making sure that an undo/redo command does what it is expected to.
A quick way of summarizing the above paragraph is that undo/redo commands apply to the panes separately, and not to the application as a whole.